
2024 U.S. House Election Results: Republicans Secure a Narrow Majority Ahead of the 2026 Midterms
The Republican Party retained control of the U.S. House of Representatives in the November 5, 2024 elections, winning 220 seats compared with 215 for the Democratic Party.
The results gave Republicans a narrow five-seat advantage in the 435-member chamber, where 218 seats are required for a majority.
What Does the 2024 House Election Map Show?
2024 US House Election Results Map
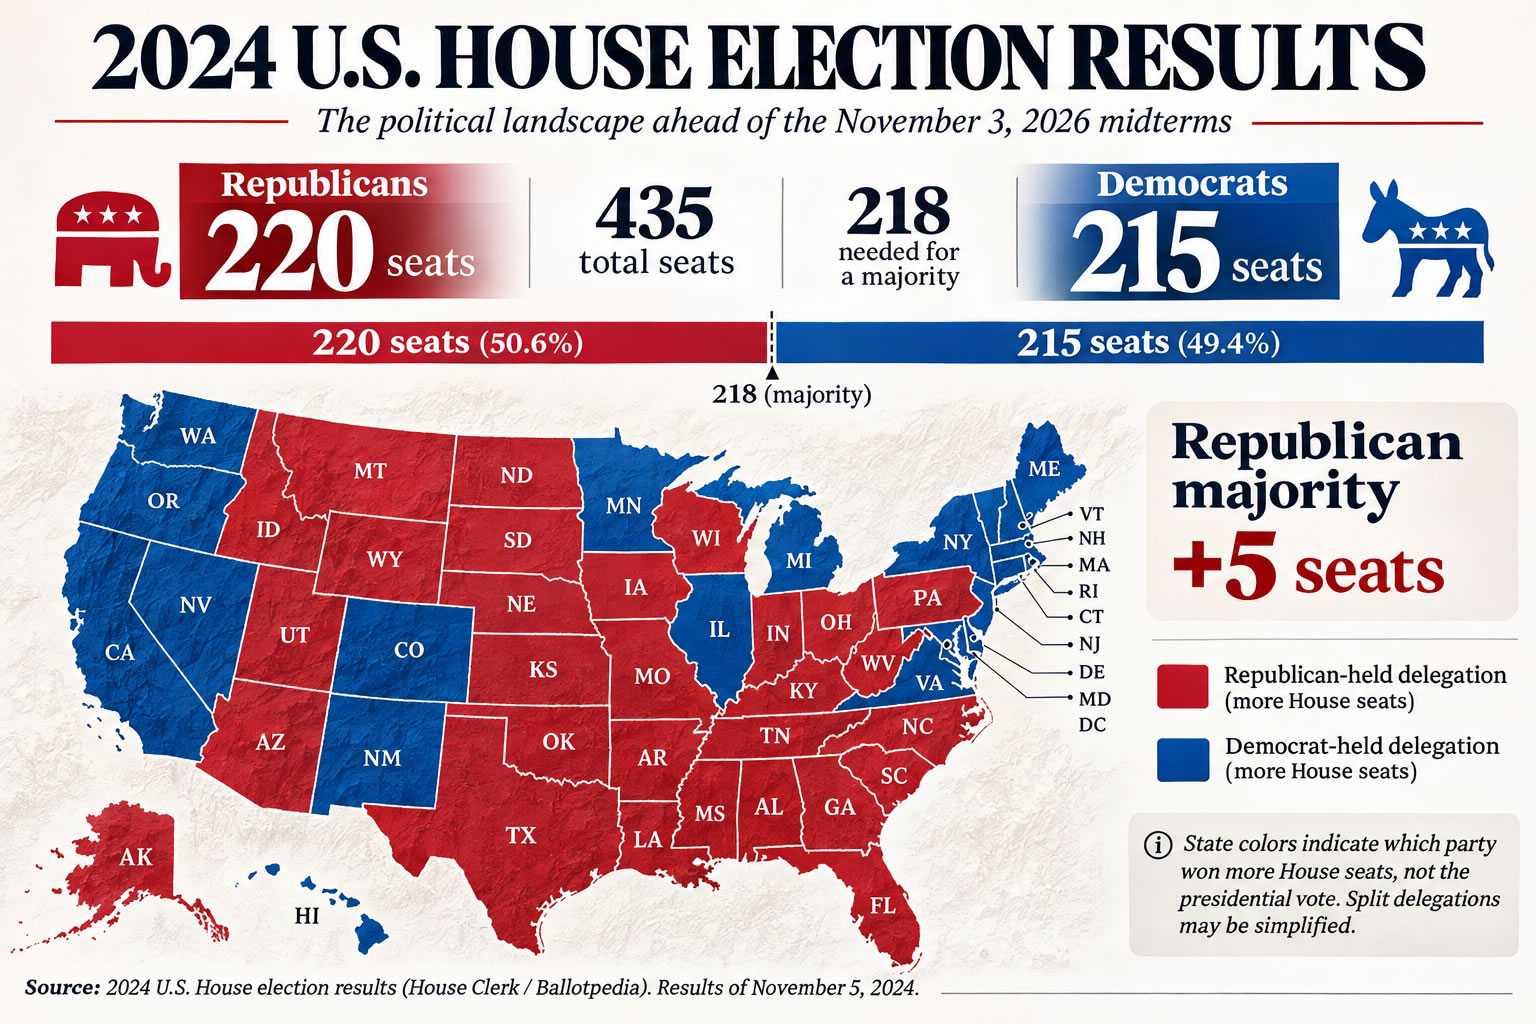
The map illustrates the political balance across the United States following the 2024 congressional elections. Red represents Republican control, while blue represents Democratic control.
Republicans performed strongly across much of the South and the central United States, while Democrats maintained substantial representation in the Northeast, along the West Coast and in several major metropolitan regions.
However, statewide colors do not tell the entire story. Many states elect representatives from both parties, and the number of congressional districts varies significantly according to population.
Why the Results Matter for the 2026 Midterm Elections
2024 House Popular Vote And Seat Total In Each US State

On November 3, 2026, American voters will elect all 435 members of the House of Representatives.
The narrow Republican victory in 2024 makes the 2026 midterm elections particularly significant. Democrats will attempt to regain control of the chamber, while Republicans will seek to defend their majority.
Competitive congressional districts in states such as California, New York, Pennsylvania, Michigan and Arizona could play an important role in determining which party controls the House.
The outcome will influence the balance of power in Washington and President Donald Trump’s ability to advance his legislative agenda during the second half of his presidential term.
2024 U.S. House Election Seat Distribution
| Political Party | Seats Won | Percentage |
|---|---|---|
| Republican Party | 220 | 50.6% |
| Democratic Party | 215 | 49.4% |
| Total | 435 | 100% |
Map data: November 5, 2024 U.S. House elections. Republicans: 220 seats. Democrats: 215 seats. Total: 435 seats.
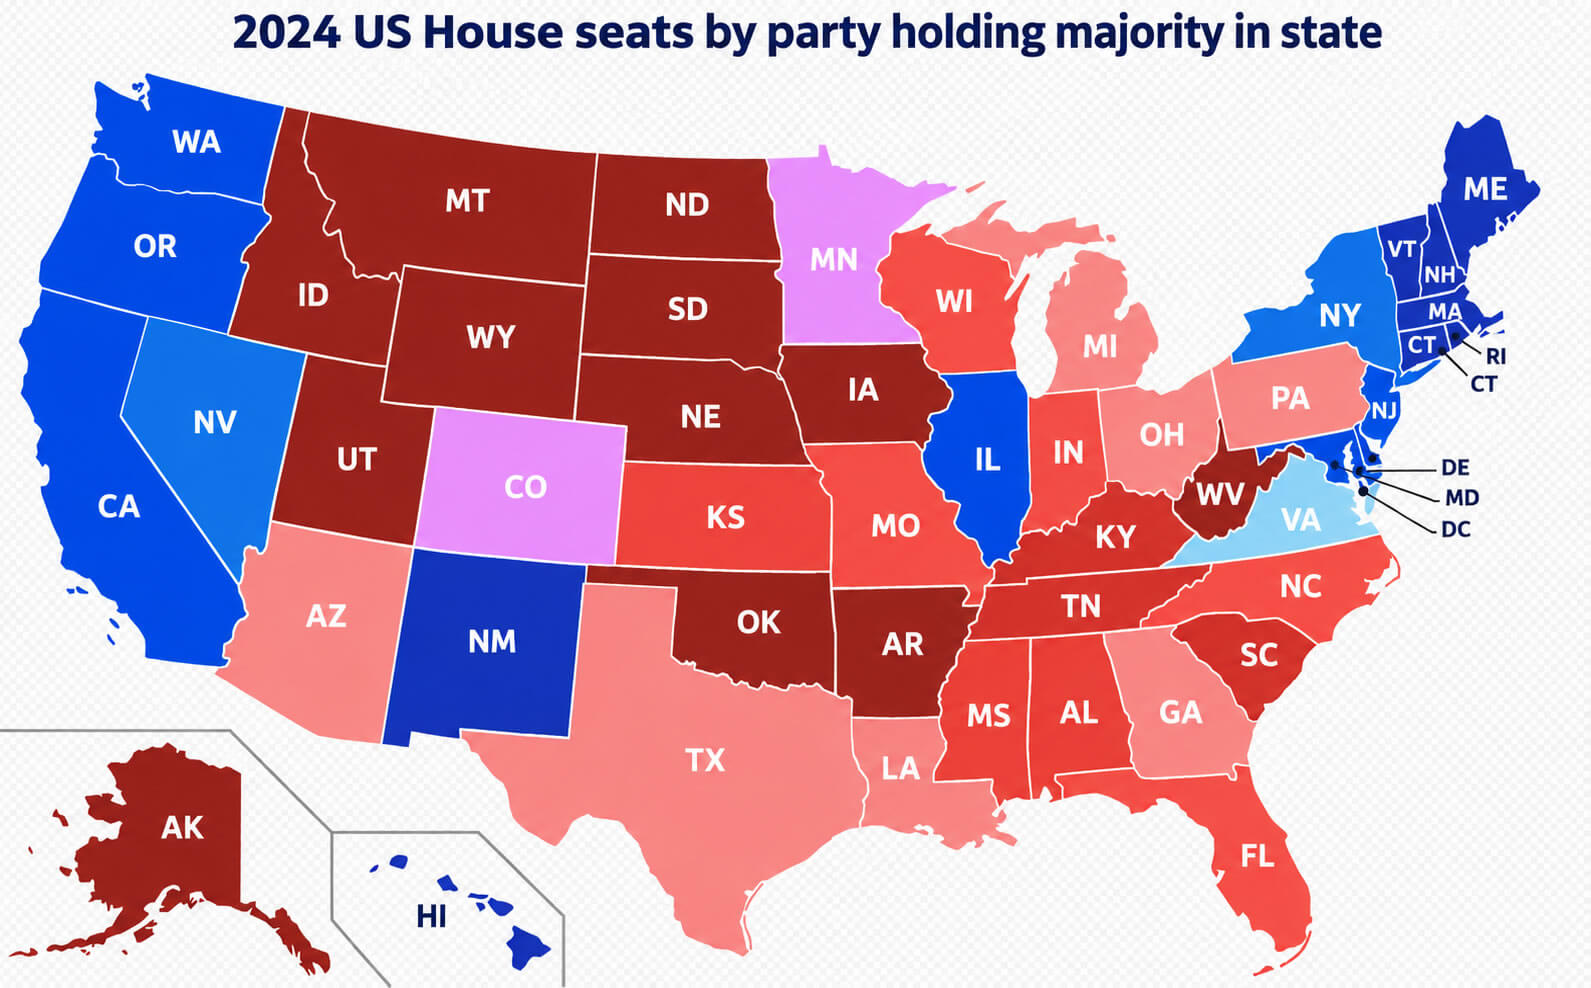
2024 US House Seats By Party Holding Majority In State
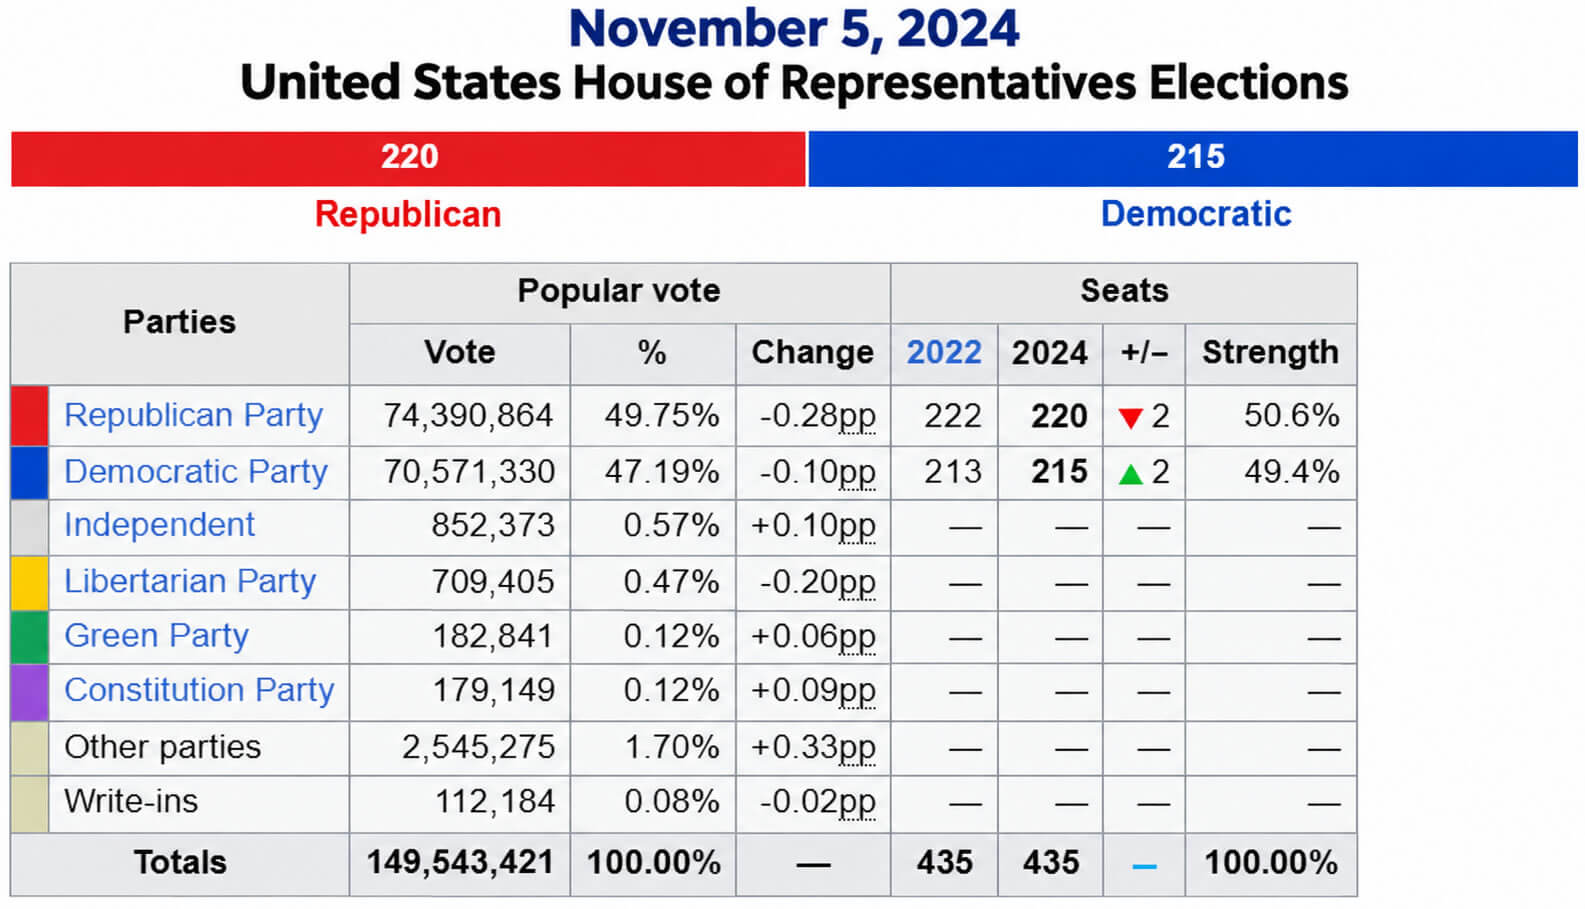
November 5 2024 United States House Elections Results
Feel free to explore US election maps:
- 2024 US Presidential Election Swing States by Maps ↗️
- The US presidential election in Georgia: Predictions for 2024 and a look back at the swing in 2020 ↗️
- Michigan on the Edge: 2024 US Election Predictions and the 2020 Turnaround ↗️
- Arizona’s US Presidential Election: 2024 Predictions and a Look Back at the 2020 Swing ↗️
- United States Map ↗️
- Map of United States ↗️
- US States Map ↗️
- United States States Map ↗️
- Political Map of the US ↗️
- United States Political Map ↗️
- United States High-resolution Map ↗️
- US High-resolution Map ↗️
- Gulf of America (The Gulf of Mexico) Map ↗️
- US Population Map ↗️
- US Time Zone Map ↗️

